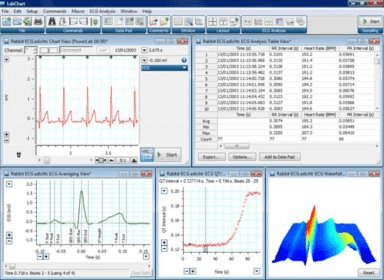
The MLS360/7 ECG Analysis Module for Windows automatically detects and reports PQRST onset, amplitude and intervals, either online or offline.
The raw data is unaltered by any calculations to ensure that the ECG can be reanalyzed. Default detection and analysis parameters are included for human, pig, dog, rabbit, guinea pig, rat and mice ECG. Detection settings can be customized at any time for optimization or for use with other animals.
The ECG Analysis Module should be used with the latest version of LabChart.
The ECG Analysis Module is also available as part of LabChart Pro.
Main Features :
- Allows real-time analysis of incoming ECG analysis.
- Analysis of ECG data from any species and includes tailored algorithms for human, rat and mouse ECG analysis.
- Settings are customizable for optimal identification of ECG waveforms.
- Automatic detection and averaging of ECG cycles with the option to average a specified number of beats, or all the beats across a specified time period or in a block.
- ECG Beat Classifier identifies ectopic beats and other cardiac arrhythmias by identifying noise-contaminated waveforms and waveforms with abnormal QRS shapes or RR intervals. Beats can be included or excluded from analysis by positioning the movable red box limit lines.
- Beat marker colors correspond to the signal's 'form' and 'noise' factor selections in the ECG Beat Classifier View. The first beat marker is always displayed in gray. Beat markers included in analysis are green. Red marker color indicates exclusion from analysis based on signal noise. Blue color indicates exclusion due to form factor, and pink signifies exclusion due to noise as well as form.
- ECG Beat Averaging View is useful in reducing the effects of noise or movement artifacts and to compare effects on the ECG before and after experimental intervention.
- Provides automatic logging and displaying of selected ECG parameters of start, end, amplitude and PQRST interval times in tabular and graphical format.
- ECG Table view parameters can be added to the Data Pad or exported to other graphing or statistical programs.
- Automatic generation of Analysis Plots from calculated parameters
- Linked LabChart, Beat Classifier, Averaging and Table Views for quick navigation to points of interest with any manual edits performed marked in red.

Spike Histogram helps record and analyze extracellular spike data in real time.
Allows piping engineers to accurately and efficiently calculate stress levels


Comments